Graph & Mind Map
In Lattics, the Graph is a tool used to assist thinking and visualization writing. There are three types of views in the Graph:
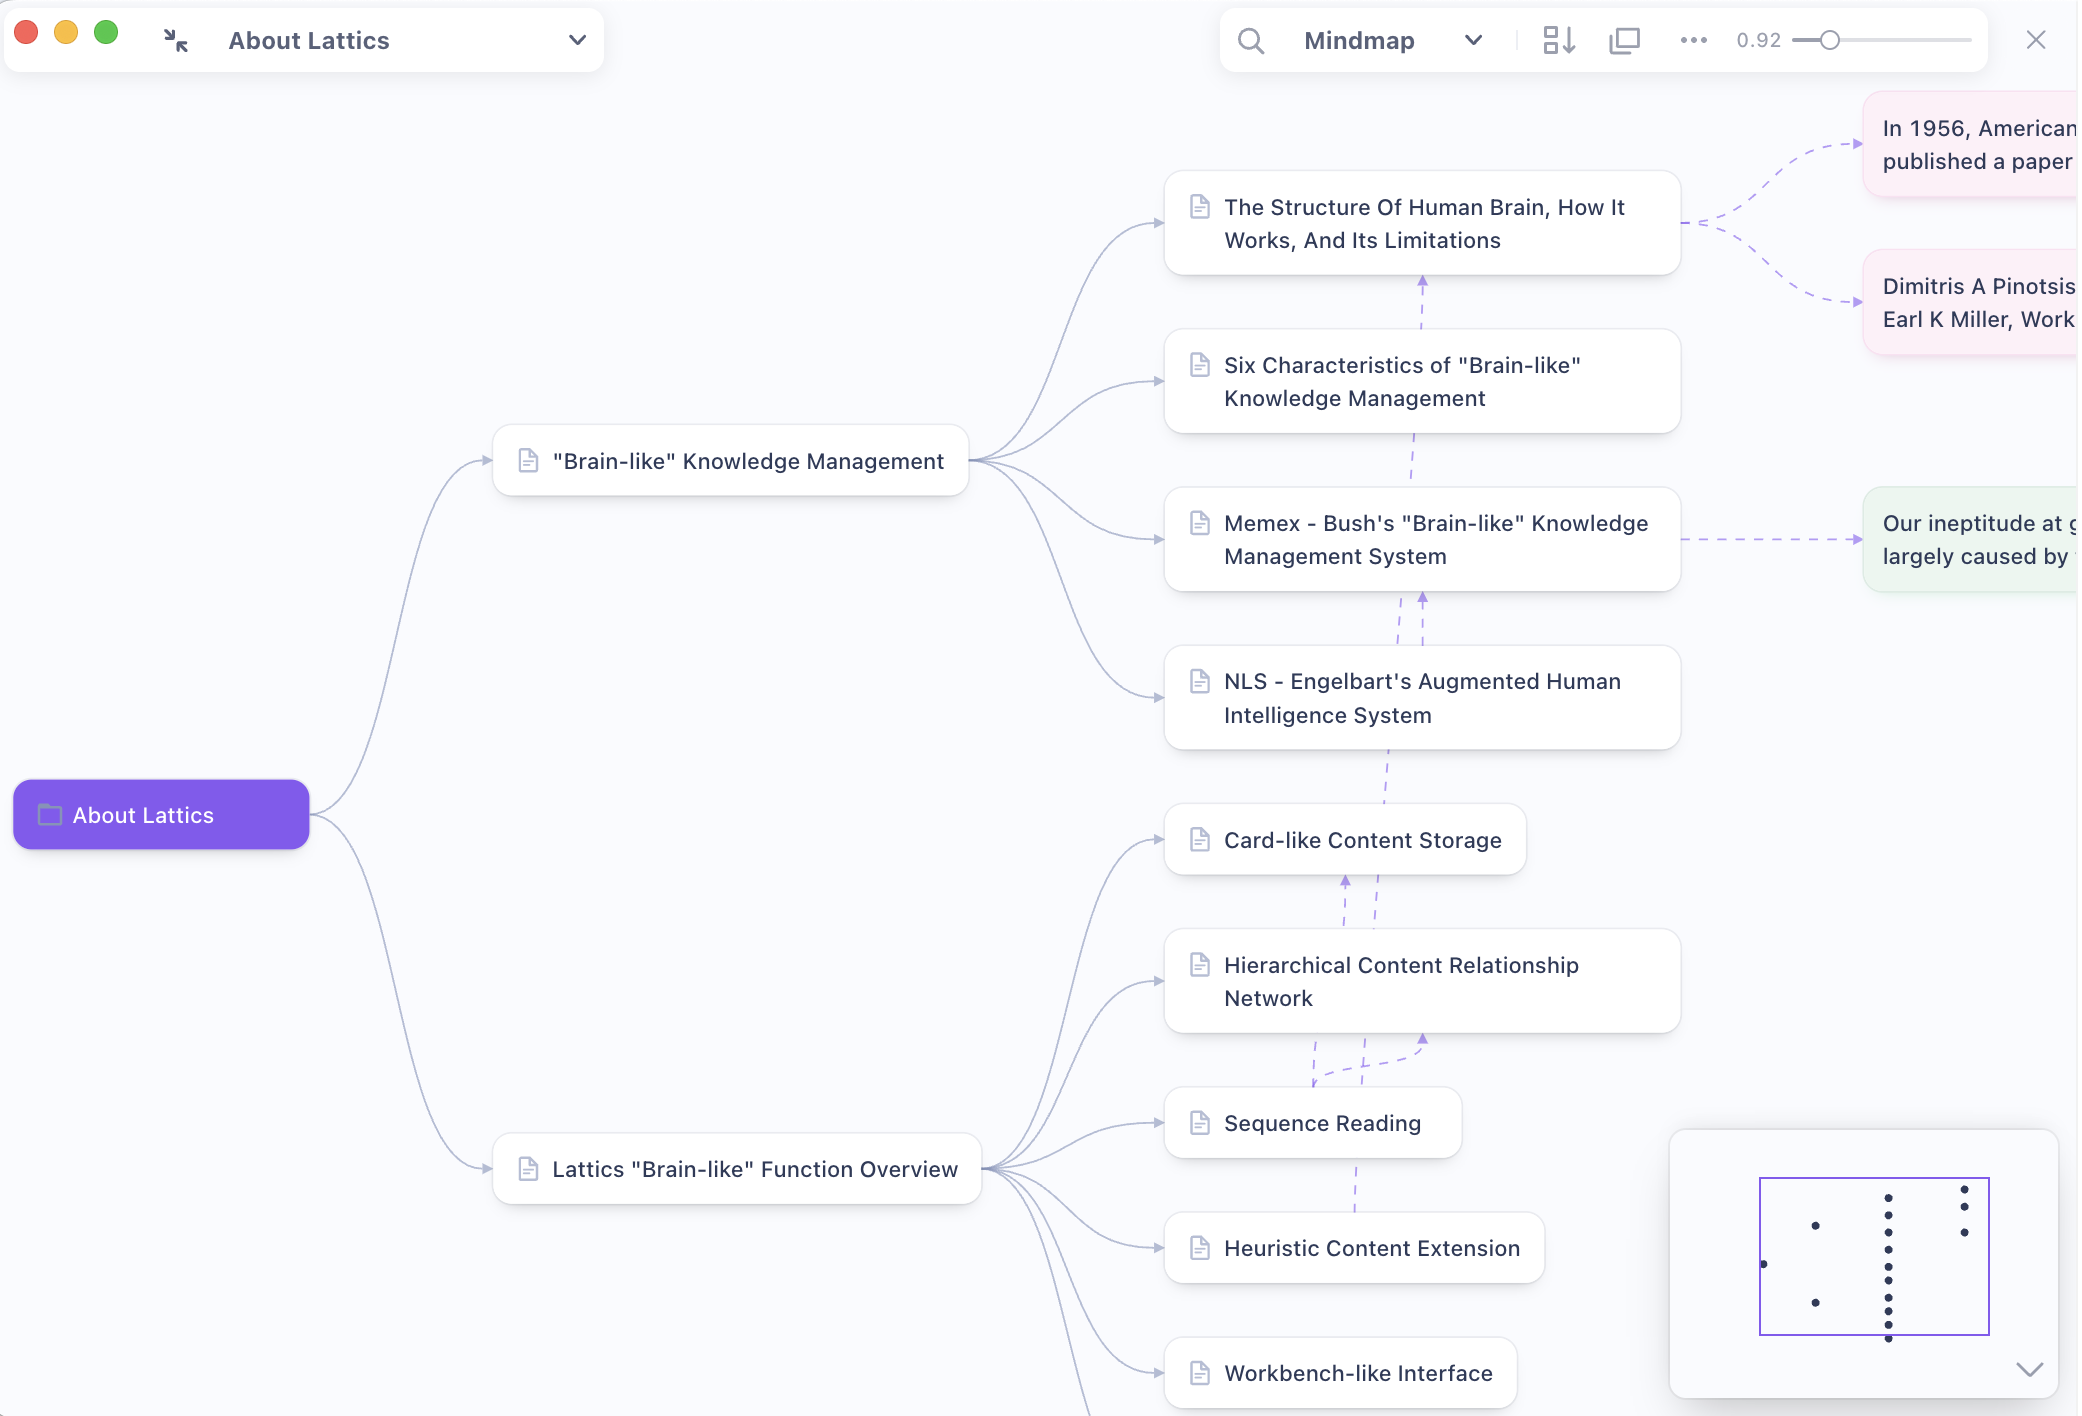
Mind Map The mind map of Lattics is actually a visualized form of the Project Outline, and each node corresponds to an article or file in the Project Outline. However, the mind map will also display the relationship between each article, files or cards, and the relationship can be created manually. Mind maps are suitable for helping authors organize their writing ideas and sort out the framework in a visualize and comprehensive way. New nodes can be created in the mind map, and nodes can be dragged and moved to change their hierarchical relationships. These changes will be updated sync with the Project Outline. That is, the structure of the Project Outline will always be consistent with the structure of the Graph
Plot of Story When writing a novel, in addition to planning the narrative structure, you also need to design the plot for each story. You can use the Plot of Story view of Lattics to achieve this. Each node in the plot view is displayed as a title + memo The memo is stored in the extension information of the corresponding article or card and can be viewed in their extension interface. The nodes and structure of the plot view also correspond to the project outline one by one, keeping in sync
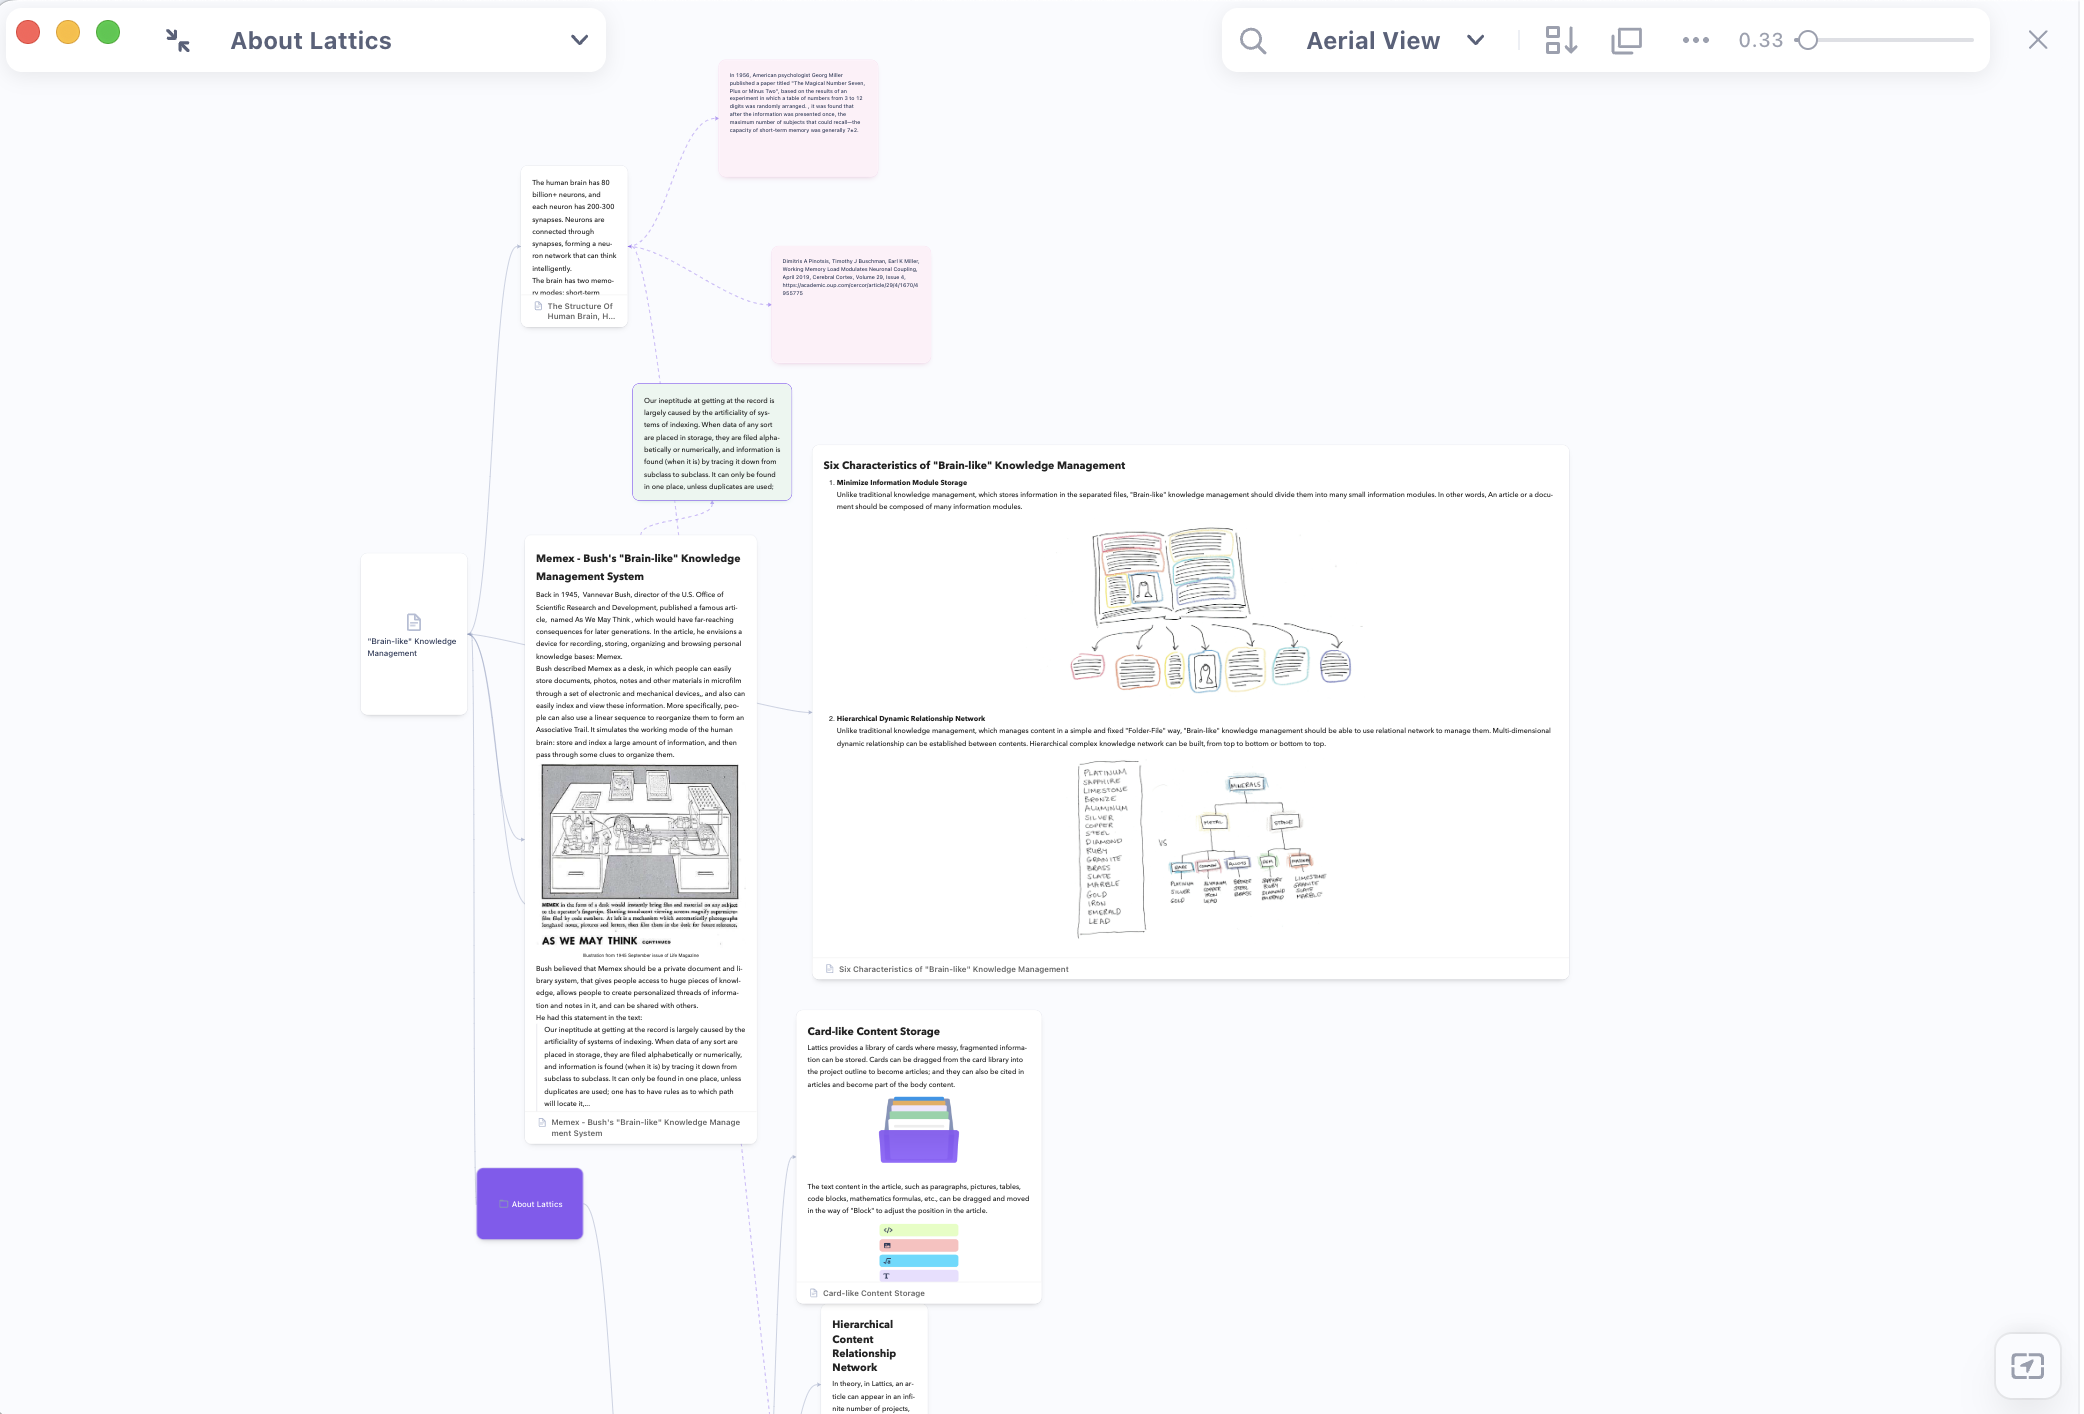
Aerial View The aerial view will display the text content of the article, PDF file or card directly, which can more intuitively understand the layout and style of each node content. The size of each node in the aerial view can be enlarged or shrunk by dragging the lower right corner of the node, that is, you can completely layout your most comfortable visual writing experience
The aerial view is suitable for users who like to write directly in the Graph. This is a very new writing experience. which is visually in the established narrative framework, and all articles are unfolded in front of you at the same time.
There are some important interactions in the graph that you need to know:
Double-click a node: it will open a pop-up window to display the content of the node
Multiple selection and batch processing: press the Shift key and use the mouse to click or box select multiple nodes. You can drag and move these nodes at the same time, or use the batch processing menu at the top of the interface to export, merge, set labels, mark, remove and delete
Search: the Graph supports two search modes, "Spotlight" and "Global", the former will highlight the nodes containing the keyword, and the latter will search all articles, cards and files in Lattics, and you can drag the search results into the Graph
Automatic layout: you can freely drag and move nodes in Graph, which may cause the node layout to be messy. They can be arranged neatly through automatic layout
Standalone window: Like the Card Library, the Graph can also be opened in an Standalone window and side by side on the desktop with the main interface
Panorama Map: If there are many nodes in the Graph, one screen may not be able to display them. At this time, you can use the panorama map in the lower right corner of the interface to locate the required area